Strategies
The platform allows few ways where user is able to execute strategies including executing strategies inside the Validator, Chart and Optimizer. Each section has its own specifics. Please refer to each section in particular for more details.
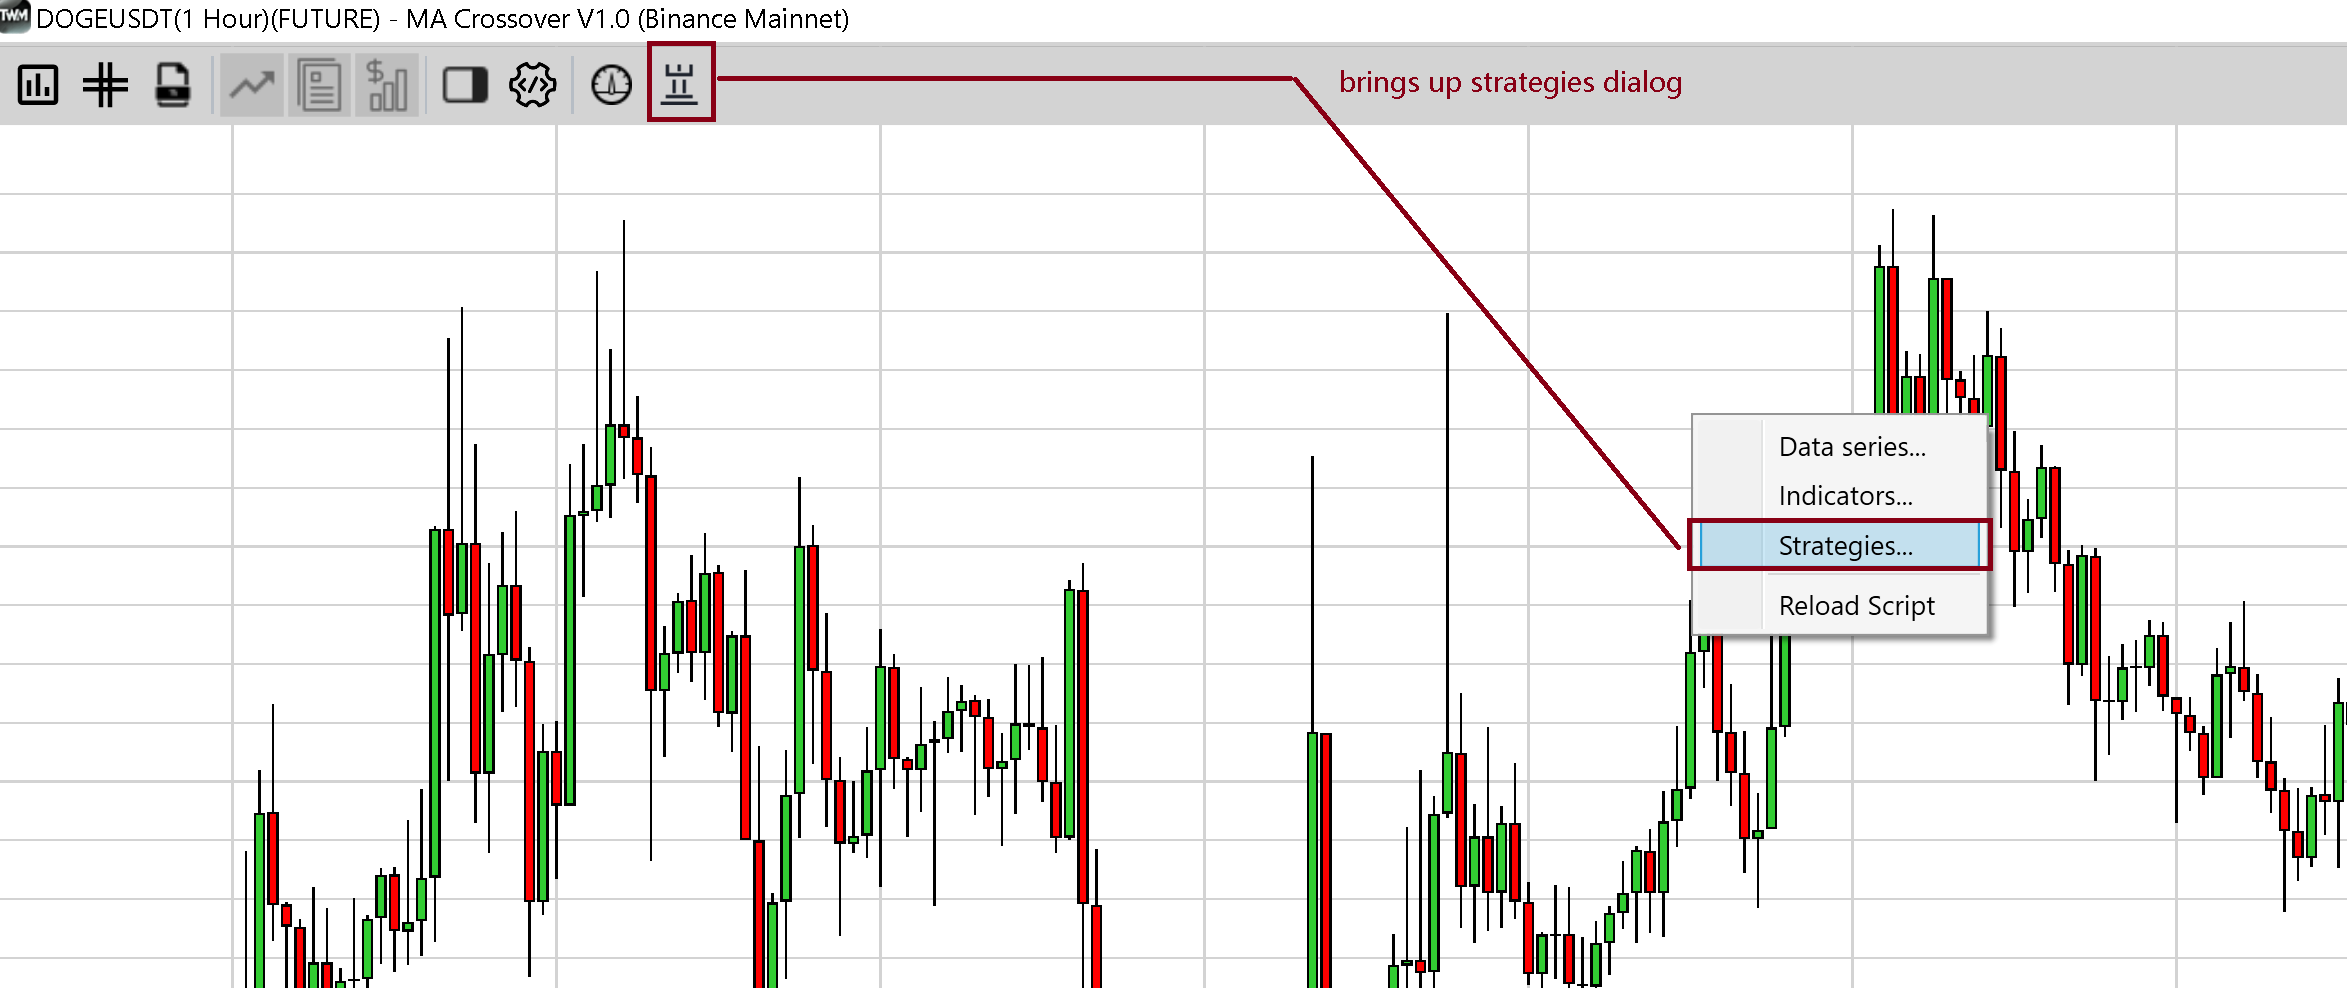
Executing Strategies on Chart#
The chart is used to execute strategies mainly during live sessions. However, you can also use it for executing strategies for backtesting purposes through the historical part of the chart. In order to bring up the strategies dialog either right click and use the context menu or use the strategy button inside the top toolbar.
Strategies Dialog Box#
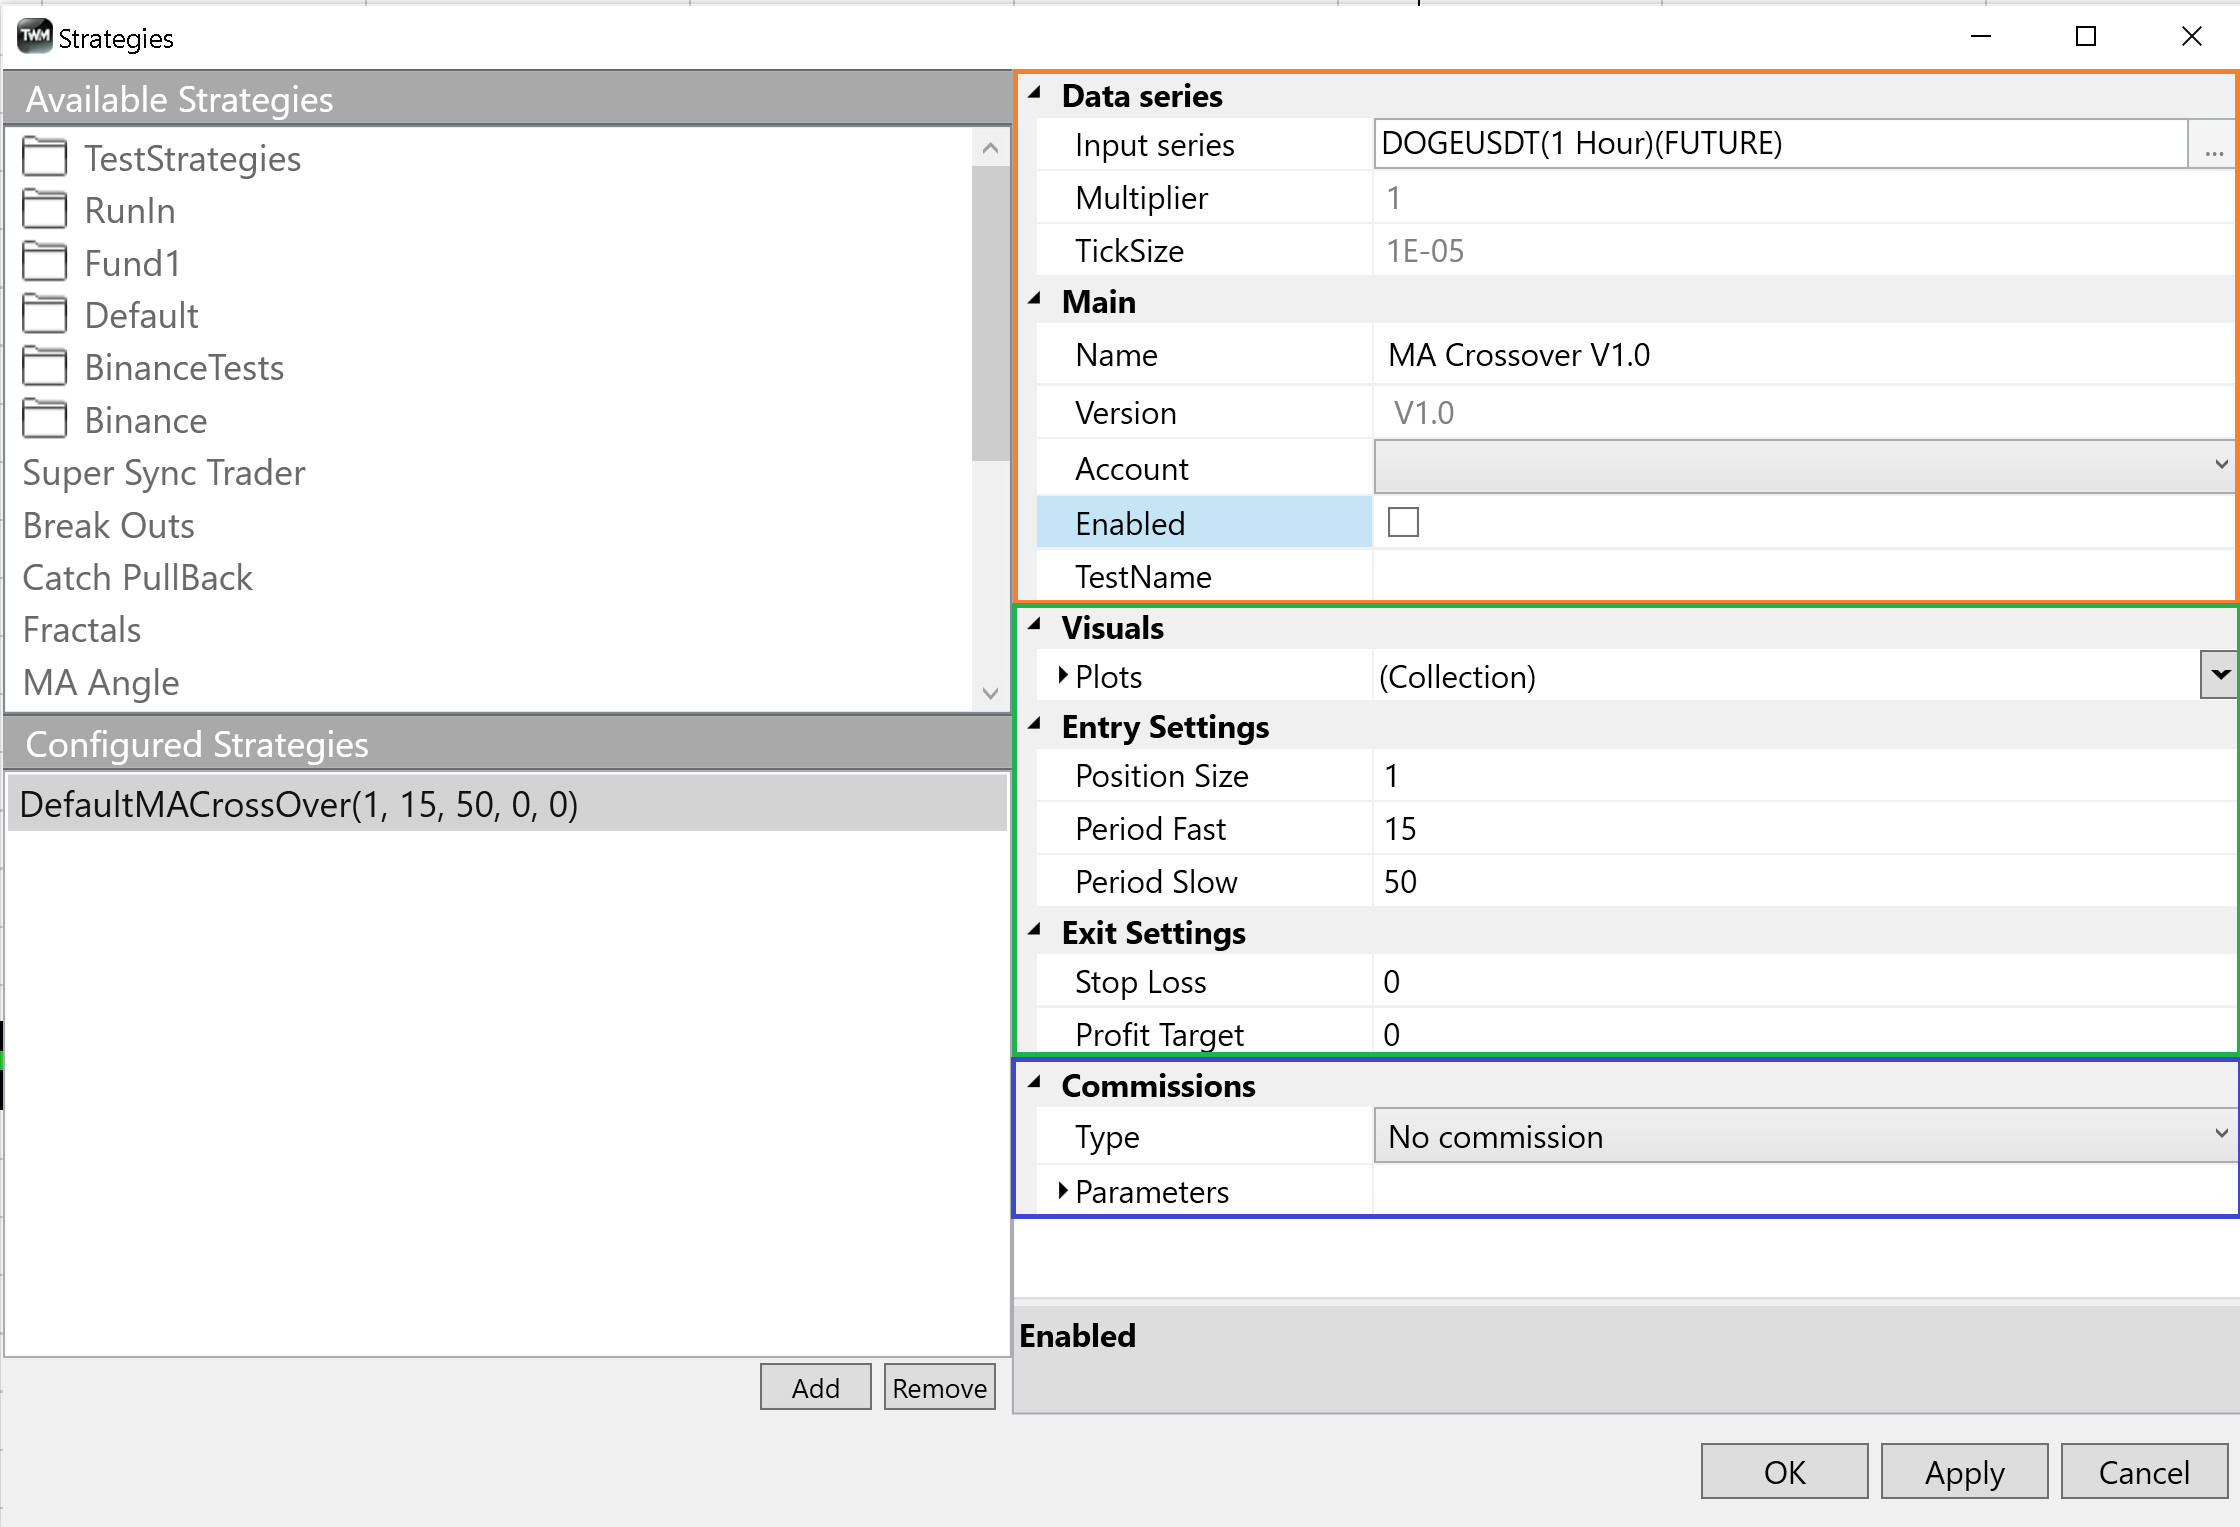
The available strategies are sourced from the compiled CustomDLL project of your TWMCustom project located where you have located it to. Please refere to compilation section of this documentation for more information on this.
To add a strategy to chart select the desired strategy from the top list and double click it or click add. After that it will get added to the bottom list signifying that it is now ready to be configured in the appeared menu on the right hand side of the dialog.
Check the enabled check box and click ok or apply to finish the initialization.
The strategy configuration window can be devided into a few zones.
Red Section
- demonstrates the data series that the strategy has been enabled on
- shows some usefull instrument parameters like minimum price fluctuations (TickSize)
- shows name and version of the strategy
- shows the account that the strategy is now trading on
Green Section
- The green section is completely dedicated to the strategy unique parameters coded by the user
Blue Section
- The blue section is dedicated to any other available global extensions such as comission module that can be set up and coded externally just like strategies and indicators.
Understanding Performance#
You can review strategy performance at any point whilst it is enabled on chart by clicking on the performance button located in the top toolbar.
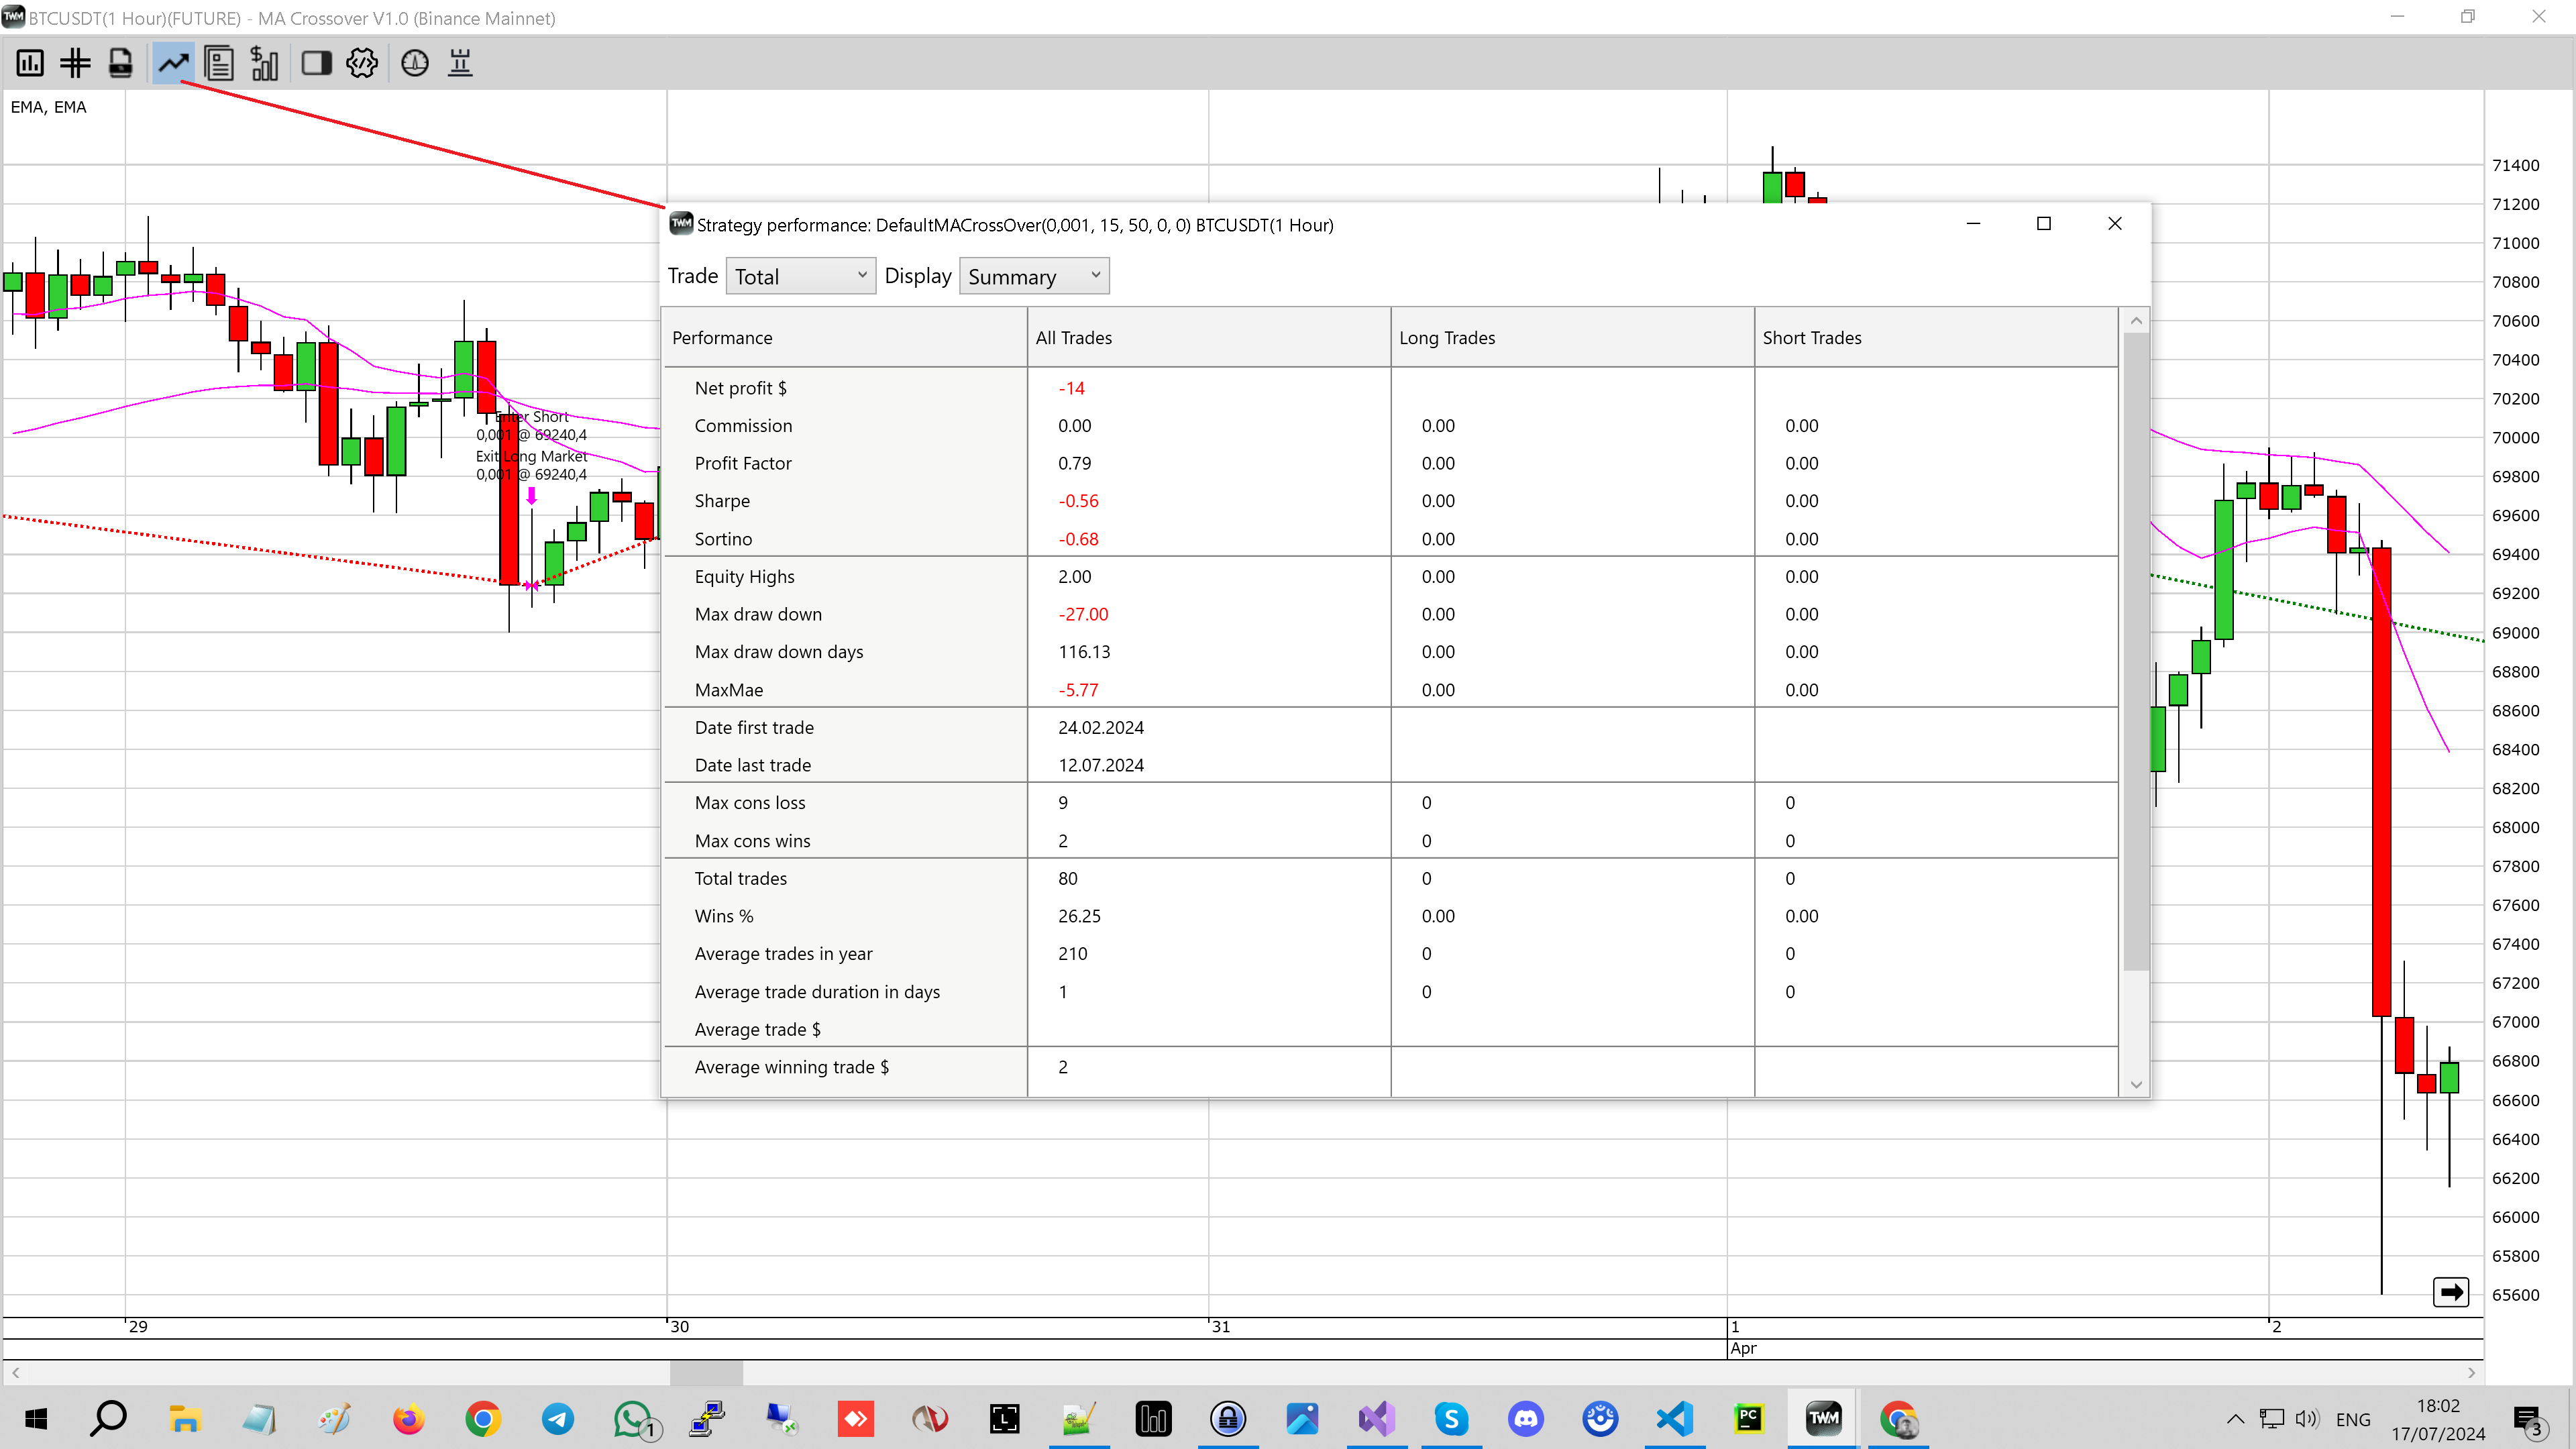
The performance window can be operated using the two main drop down menus. The left one Total Historical Live filters performance by the strategy state. The right one Summary Analysis Trades Orders allows the user to review different aspects of strategy performance.
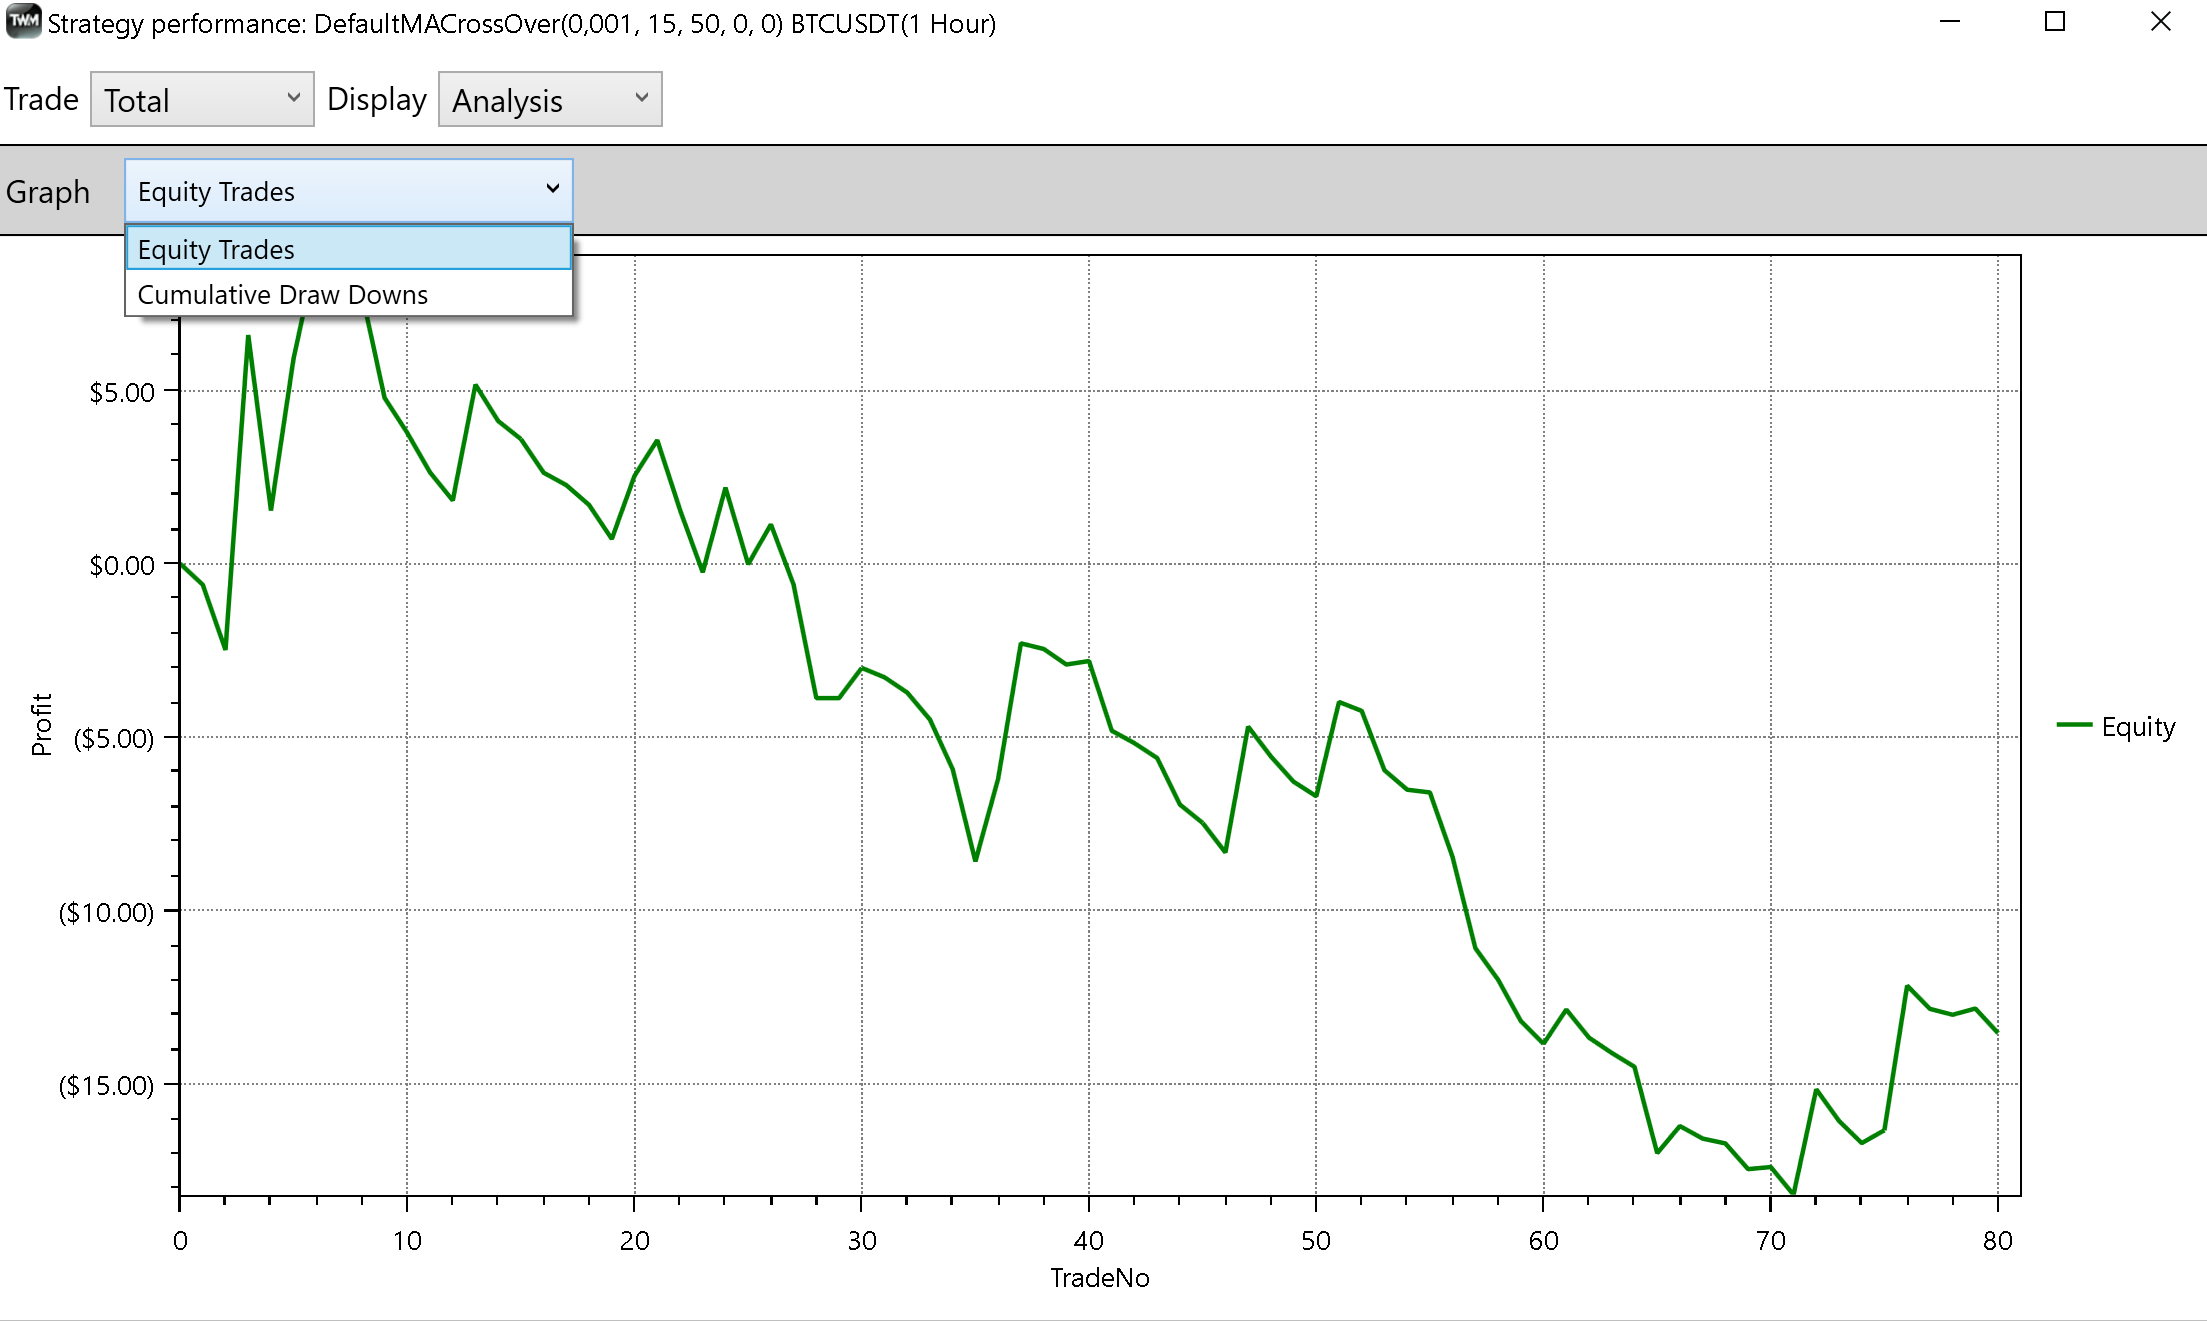
Analysis#
The analysis performance allows the user to review two types of charts. Equity and drawdown, navigated using the top drop down.
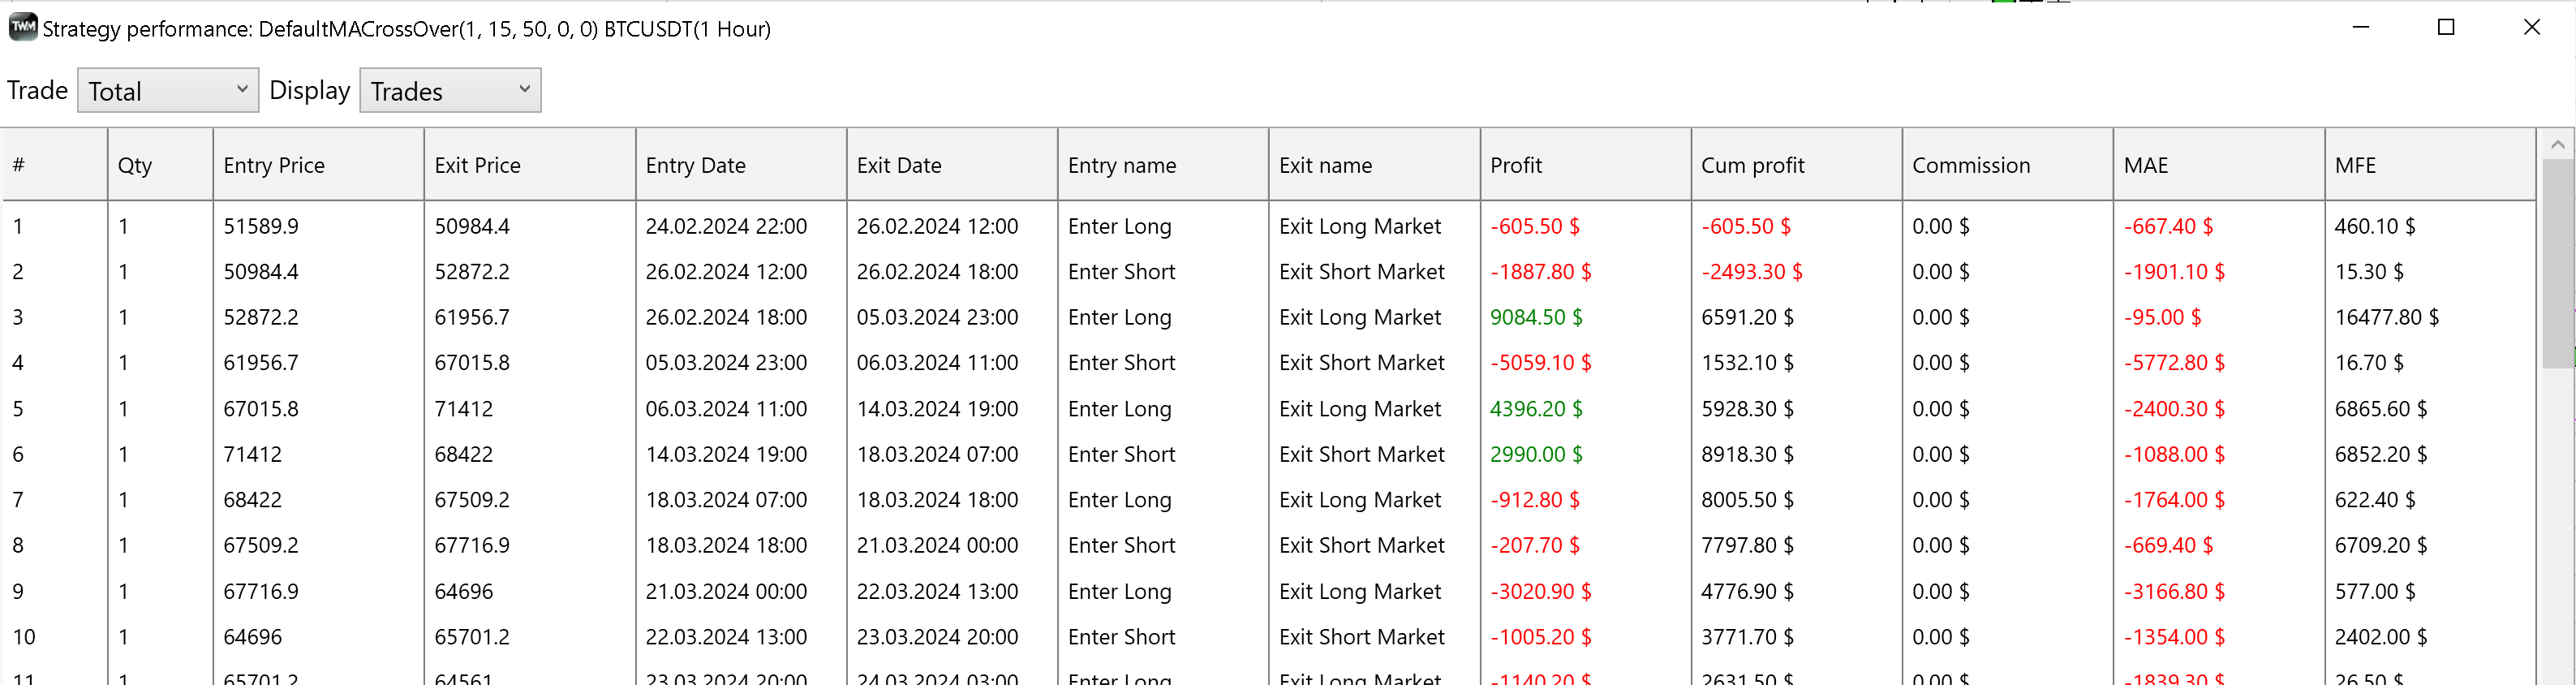
Trades#
The strategy pnl is calculated using the quote side of the trading pair. For example in a BTCUSDT trade the profit will be demonstrated in USDT values for both SPOT and FUT trades. The exit name and entry name fields will use the order name used to close/open a certain trade.
MAE and MFE values are calculated using bar high/low prices during the open trade. MAE - maximum advance excursion shows the max possible trade drawdown. MFE - maximum forward excursion shows the max possible profit it reached before it got closed.
Lot Size#
When trading using strategies it is very important to understand the lot size parameter. For instance, when trading BTCUSDT the trade is placed using a BTC value. Make sure you are not using a value less the minimal value allowed by the exchange for a particular instrument. Please refer instrument section for more details.