Indicators
TWM comes preset with over 30 default indicators. Each indicator source code is open for review within the Custom project. Below you can find overall description of Indicator API.
Input#
In the below example we can see that the Input[0] is used. This indicates that anyhting that the user assigns as the input will be passed into this series. This is true for UI as well as for bringing input from other indicators and/or strategies. By default the Close prices are passed, however this can be adjusted if the indicator is designed to do so.
public override void OnBarUpdate(){    _priorSum = _sum;
    _sum = _priorSum + Input[0] - (CurrentBar-1 >= Period ? Input[Period] : 0);    MA[0] = _sum / (CurrentBar-1 < Period ? CurrentBar : Period);

}Below we can see the EMA indicator gets initialized with a High and Low series passed as input. If we do not pass anything as the first parameter, the Close series will be passed by default under the hood.
private Indicator _maFast;private Indicator _maSlow;
private void AddIndicators(){    _maFast = EMA(High, PeriodFast);    _maSlow = EMA(Low, PeriodSlow);}
Initialization from Strategy#
The indicator will be plotted on chart by default if it is initialized without ScriptOptions parameter passed. User has an option to hide the indicator from chart or hide the indicator panel from chart by assigning appropriate ShowPlots and ShowPanes booleans in the ScriptOptions object.
private Indicator _maFast;private void AddIndicators(){ var options = new ScriptOptions { ShowPlots = true, ShowPanes = false}; _maFast = EMA(High, PeriodFast, options);}
Pane & Plot & Series#
The indicator has to be created in a certain order.
- Create Plot
- Create a custom pane if required and add plot to pane or to price pane
- Create Series
- Assign series data to the created plot
[Browsable(false)][XmlIgnore]public Series<double> MA { get; set; }
private Plot _plot;
public override void OnStateChanged(){    if (State == State.SetDefaults)    {        MAThickness = 1;        MAColor = Colors.Green;        Period = 14;
        //1 - create plot        _plot = new Plot(){Thickness = MAThickness, Color = MAColor};
        //2 - adding plot to existing price pane does not require extra pane creation, just add.        AddPanePlot(_plot);
        //alternatively you can add as many panes as you want and add plots to them        //you can have multiple panes within one indicator instance        var secondPane = AddPane();        AddPanePlot(secondPane, _plot);    }    else if (State == State.Configured)    {        //3 - create an empty series and use AddSeries to enable it        MA = new Series<double>();        AddSeries(MA);
//4 - asign series data to plot data source _plot.DataSource = MA; }}Plot Parameters#
The plot can have some parameters that are possible to be assigned.
{ Name = "This name will come up in the data box"; Color = Colors.Blue; LineType = PlotLineType.Solid; //can also set Dashed Thickness = 2; ChartType = PlotChartType.Linear; //can also set Bars for histrogram style}If you plan to interact with plot colors inside the script, for instance by conditionally updating their color you need to make some extra settings and pass the PlotColors context.
public override void OnStateChanged(){    if (State == State.SetDefaults)    {        _plot_.PlotColors = new ColorMap(DataCalcContext);     }}
public override void OnBarUpdate(){    if (Diff[0] > 0)    {        _diff.PlotColors[0] = Brushes.Green;    }    if (Diff[0] < 0)    {        _diff.PlotColors[0] = Brushes.Red;    }    }
Complex Calculations#
You can also make your calculations within the script and pass the calculated values into another indicator. This is quite common for averaging purposes. For instance calculating something inside the OnBarUpdate and passing the calculated series into an SMA.
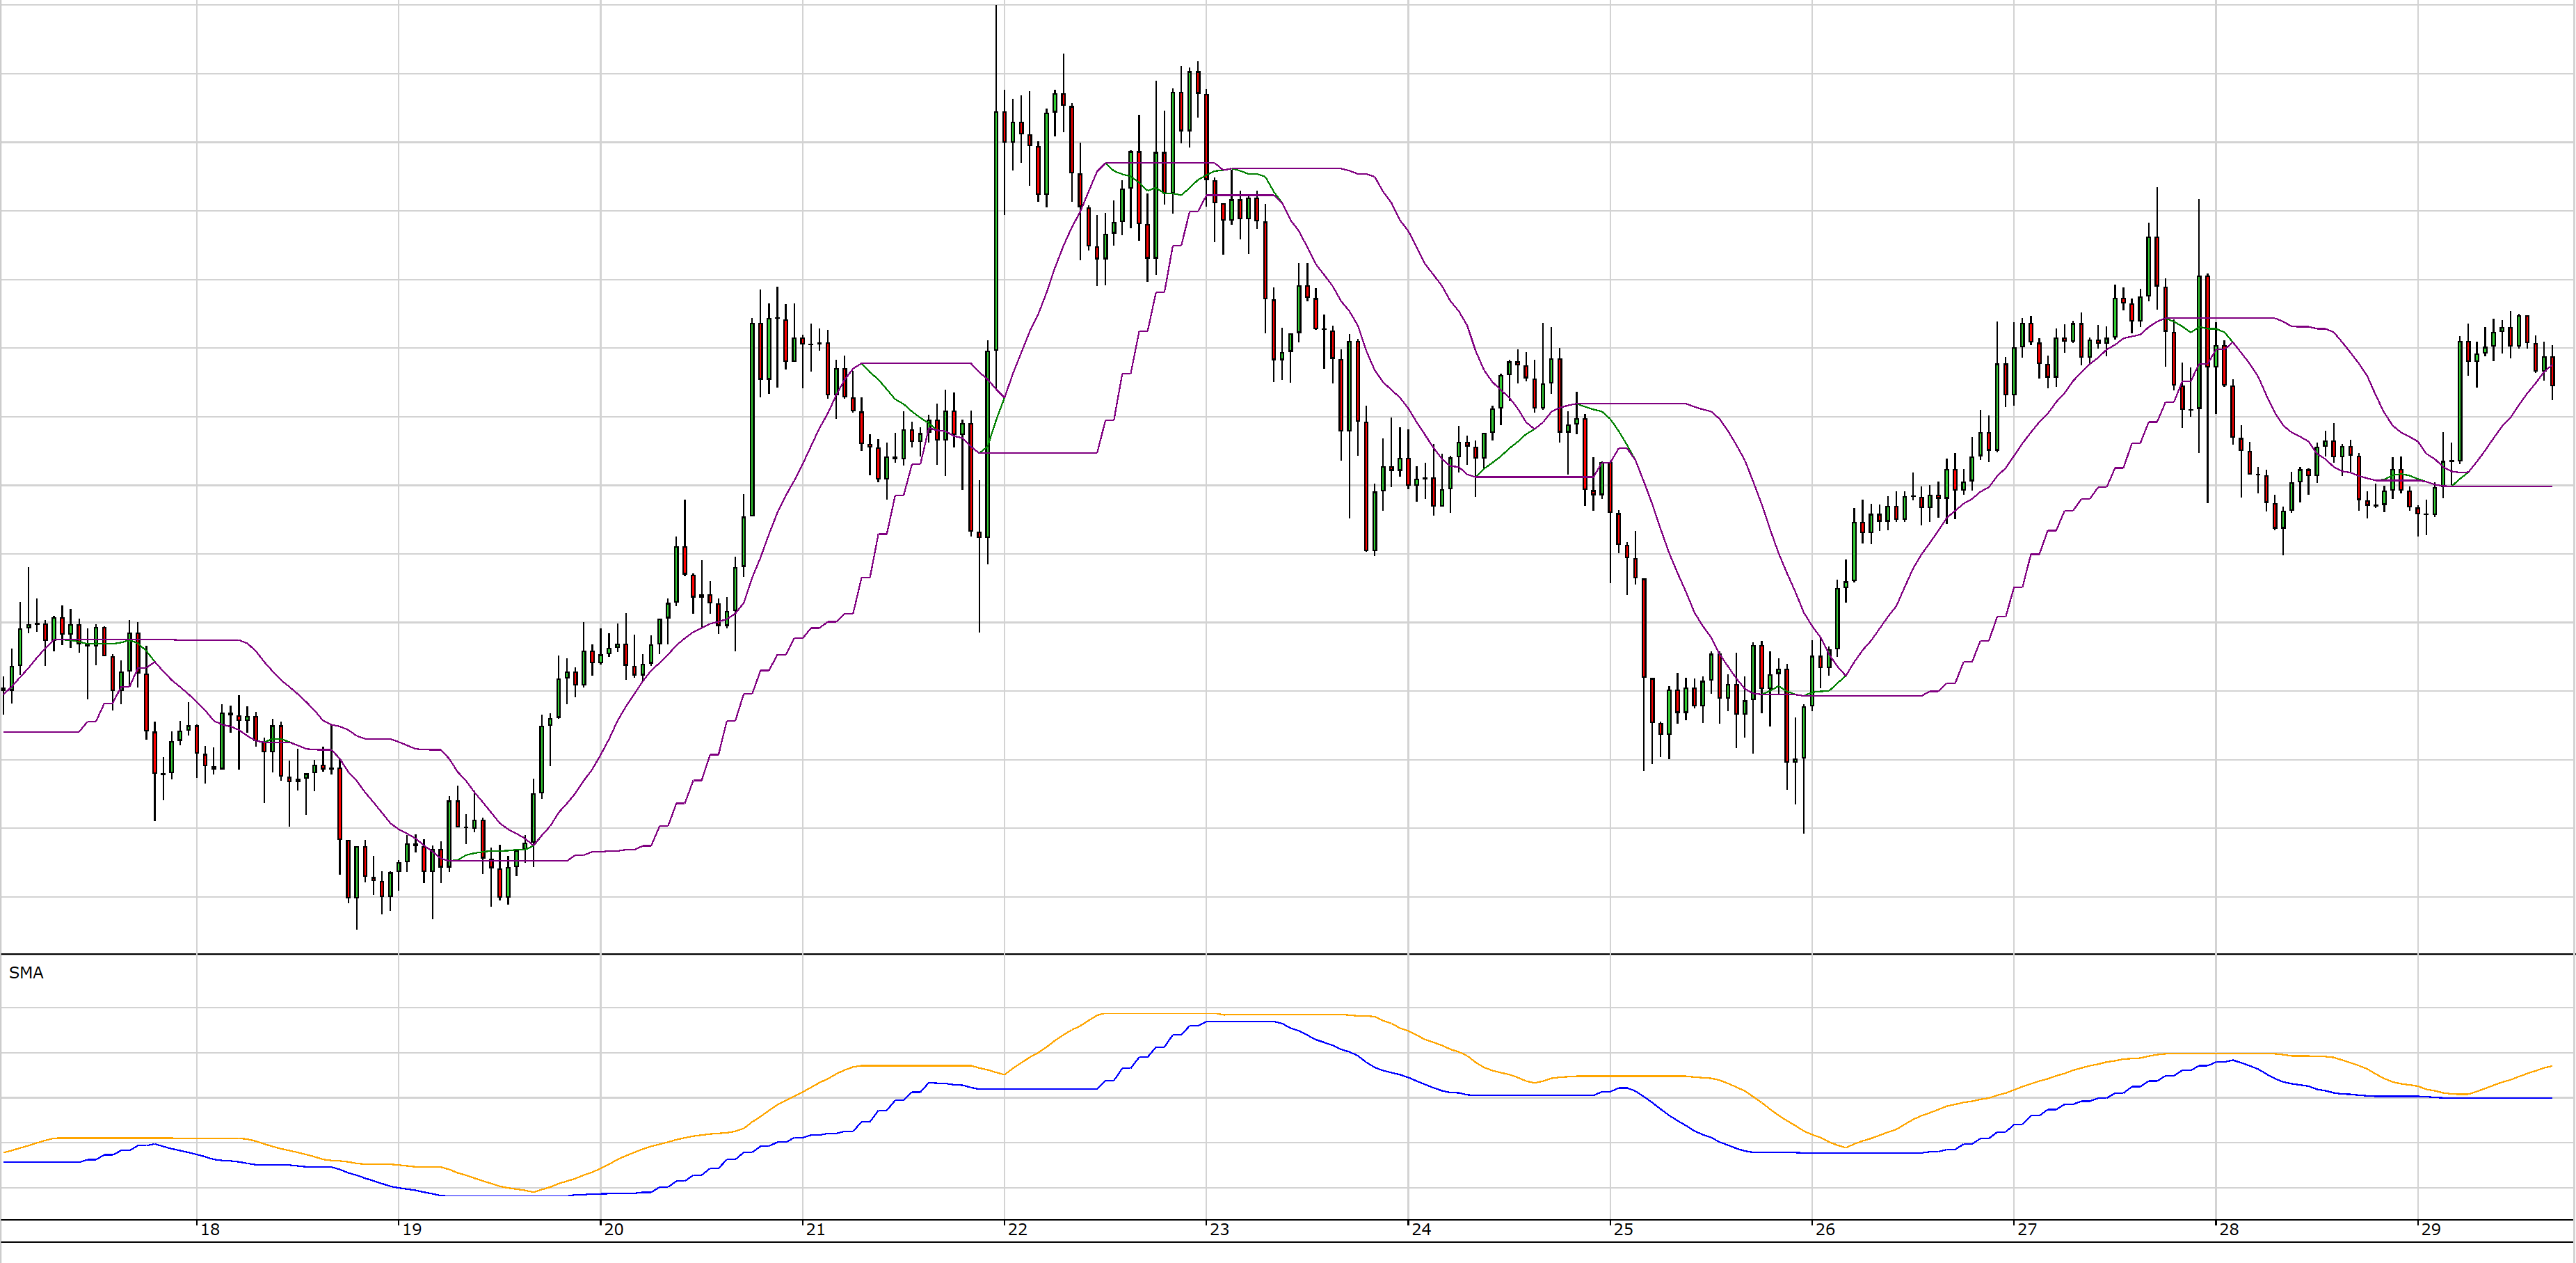
Below is an illustrated example with SMA indicator initialized on the main price pane and two extra indicators engaged on an extra pane. The additional indicators are MIN and MAX indicators using the calculated SMA value from within a single instance of the same indicator.
[Browsable(false)][XmlIgnore]public Series<double> MA { get; set; }
[Browsable(false)][XmlIgnore]public Series<double> MAMin { get; set; }
[Browsable(false)][XmlIgnore]public Series<double> MAMax { get; set; }
private Plot _plot;private Plot _plotMaMin;private Plot _plotMaMax;//additional indicators to be used with calculationsprivate Indicator _maMax;private Indicator _maMin;
public override void OnStateChanged(){    if (State == State.SetDefaults)    {        Name = IndicatorName;        Version = IndicatorVersion;
        var MAThickness = 1;        var MAColor = Colors.Green;        Period = 14;
        _plot = new Plot(){Thickness = MAThickness, Color = MAColor};        AddPanePlot(_plot);
        //creating two extra plots for MIN and MAX        _plotMaMin = new Plot(){Thickness = MAThickness, Color = Colors.Blue};        _plotMaMax = new Plot(){Thickness = MAThickness, Color = Colors.Orange};
        //adding both to same new pane        var maMixMinPane = AddPane();        AddPanePlot(maMixMinPane, _plotMaMin);        AddPanePlot(maMixMinPane, _plotMaMax);    }    else if (State == State.Configured)    {        MA = new Series<double>();        AddSeries(MA);        _plot.DataSource = MA;
        MAMin = new Series<double>();        AddSeries(MAMin);        _plotMaMin.DataSource = MAMin;
        MAMax = new Series<double>();        AddSeries(MAMax);        _plotMaMax.DataSource = MAMax;
        //assigning MA series as the input of the indicators        _maMax = Max(MA,Period);        _maMin = Min(MA, Period);    }}
public override void OnBarUpdate(){    _priorSum = _sum;
    _sum = _priorSum + Input[0] - (CurrentBar-1 >= Period ? Input[Period] : 0);    MA[0] = _sum / (CurrentBar-1 < Period ? CurrentBar : Period);
//getting the values MAMax[0] = _maMax[0]; MAMin[0] = _maMin[0];}Although the exact same output can be achieved using the next example, it is highly unrecommended to use do this because this boosts up CPU usage significantly especially of complex calculations.
public override void OnBarUpdate(){    _priorSum = _sum;
    _sum = _priorSum + Input[0] - (CurrentBar-1 >= Period ? Input[Period] : 0);    MA[0] = _sum / (CurrentBar-1 < Period ? CurrentBar : Period);
    //NOT RECOMENDED!!!    MAMax[0] = Max(MA,Period)[0];    MAMin[0] = Min(MA, Period)[0];
}